Most SEO agencies show you their best chart. This case study shows all of them. Below are unedited Google Search Console screenshots from nine client sites we have worked on between 2023 and 2026: a construction firm and a container logistics company in Karachi, a cafe in Queensland, a Greek restaurant in Toronto, an online networking equipment store, an RF component supplier, a Hong Kong life sciences company, a faith-based nonprofit in Phoenix, and a business phone systems site.
Together they add up to 8,110 organic clicks and 357,700 impressions. Some show strong, rising growth. Two show a single spike and then a flat line. We have included those too, because they teach as much as the good ones, and because SEO results you can only see the best of are not evidence of anything.
Every screenshot is labelled with its site, its tool and its date range, and each image file carries that same information in its embedded metadata.
The Results, Site by Site
| Site | Business | Window | Clicks | Impressions | CTR | Avg position | Work |
|---|---|---|---|---|---|---|---|
| Naffees & Sons | Construction, Karachi | 24 Jul to 22 Oct 2026 | 782 | 35,000 | 2.2% | 5.7 | Build, on-page, content. No link building |
| PK Transporters | Container logistics, Karachi | 24 Jul to 22 Oct 2026 | 341 | 29,500 | 1.2% | 5.8 | Build, on-page, content. No link building |
| The Hungry Pelican | Cafe, Hervey Bay, Queensland | 1 Jun to 5 Aug 2025 | 1,060 | 19,200 | 5.5% | 10.4 | On-page and local link building |
| Souvlaki Place | Greek restaurant, Etobicoke, Toronto | Apr to Oct 2023 | 538 | 3,820 | 14.1% | 12.3 | Local SEO |
| First Source Inc | RF and microwave components | Apr to Oct 2023 | 1,000 | 56,200 | 1.8% | 17.7 | Ongoing SEO |
| Forest Hills Lab | Life sciences, Hong Kong | Apr to Oct 2023 | 2,110 | 44,200 | 4.8% | 18.5 | Ongoing SEO |
| iPeepbxs | Business phone systems | Apr to Oct 2023 | 446 | 34,400 | 1.3% | 23 | Ongoing SEO |
| DSL Warehouse | Networking equipment store | Mid-Aug to early Oct 2023 | 1,100 | 91,700 | 1.2% | 26 | Technical audit, 100+ pages |
| Serenity at Heart | Faith-based nonprofit, Phoenix | Apr to Oct 2023 | 733 | 43,700 | 1.7% | 28.6 | Ongoing SEO |
A note on how to read this table. The windows are not the same length or the same year, so the rows are not a league table. The 2023 screenshots were all taken in October 2023 with Search Console set to "last 6 months"; they show where each site stood during an engagement, not a clean before and after. The 2025 and 2026 windows are newer and, for three of the sites, start close to zero, so they do show growth. We say which is which below.
Built and Marketed: Naffees & Sons and PK Transporters (2026)
These are the two results we are proudest of, because we did the whole job. We built both websites, wrote the content, set up the CMS each client publishes from, and did the on-page SEO. We did no link building for either. No outreach, no directories, no paid links.
Three months of Search Console data, 24 July to 22 October 2026:
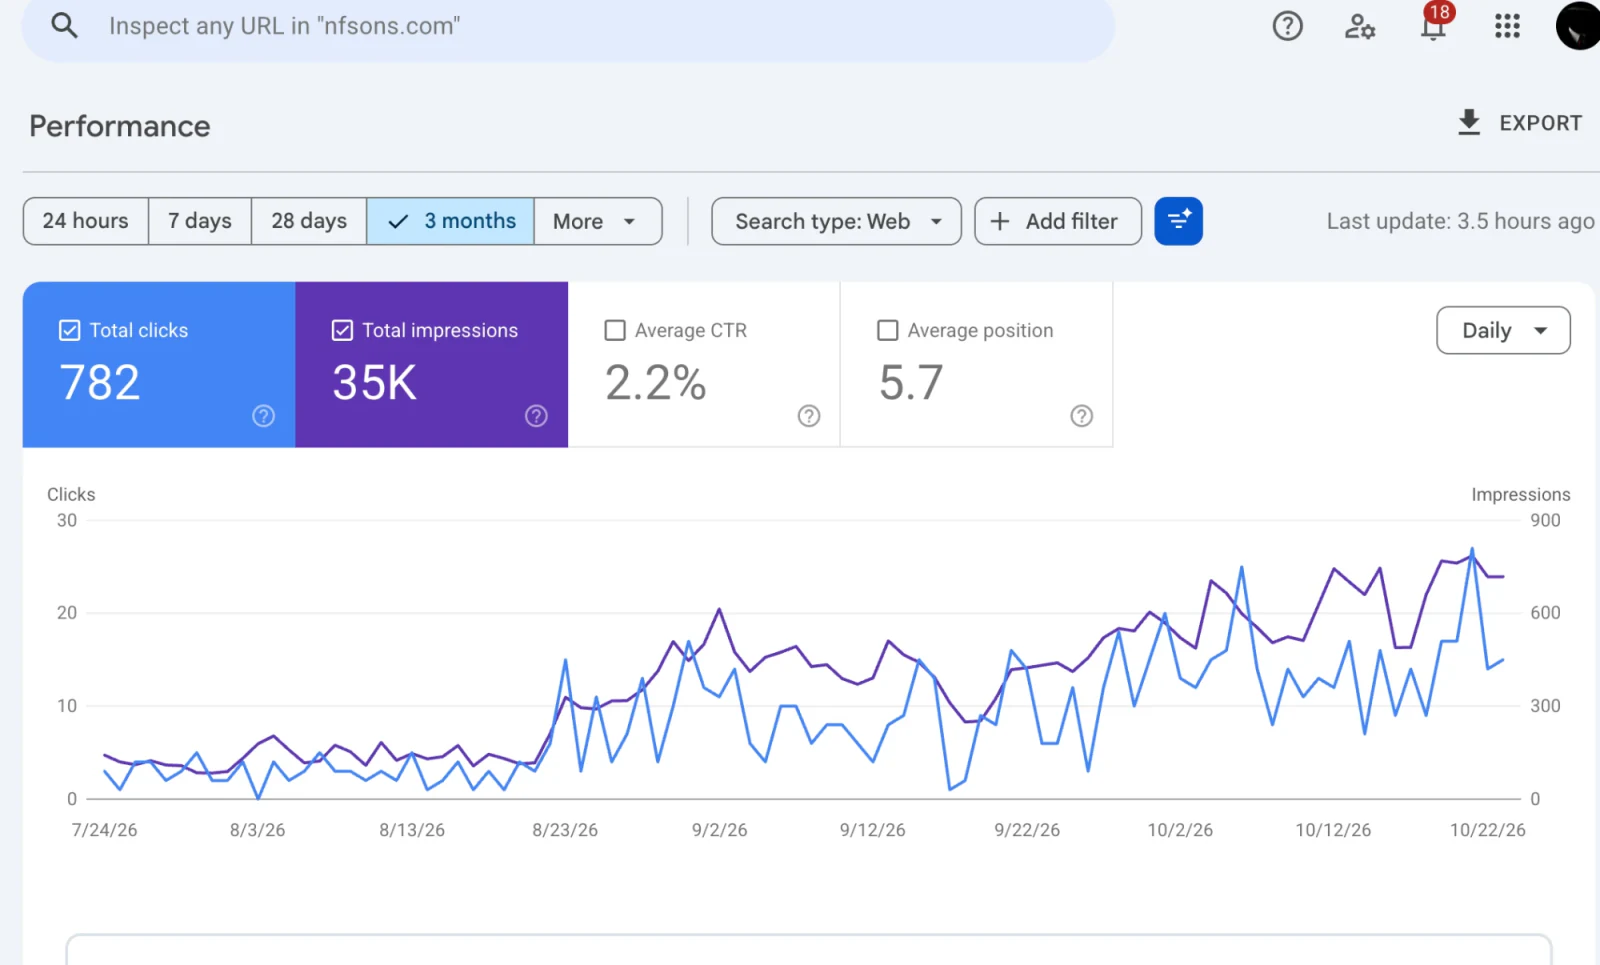
Google Search Console, nfsons.com, 24 July to 22 October 2026: 782 clicks, 35K impressions, 2.2% CTR, average position 5.7. On-page SEO and content only; no link building.
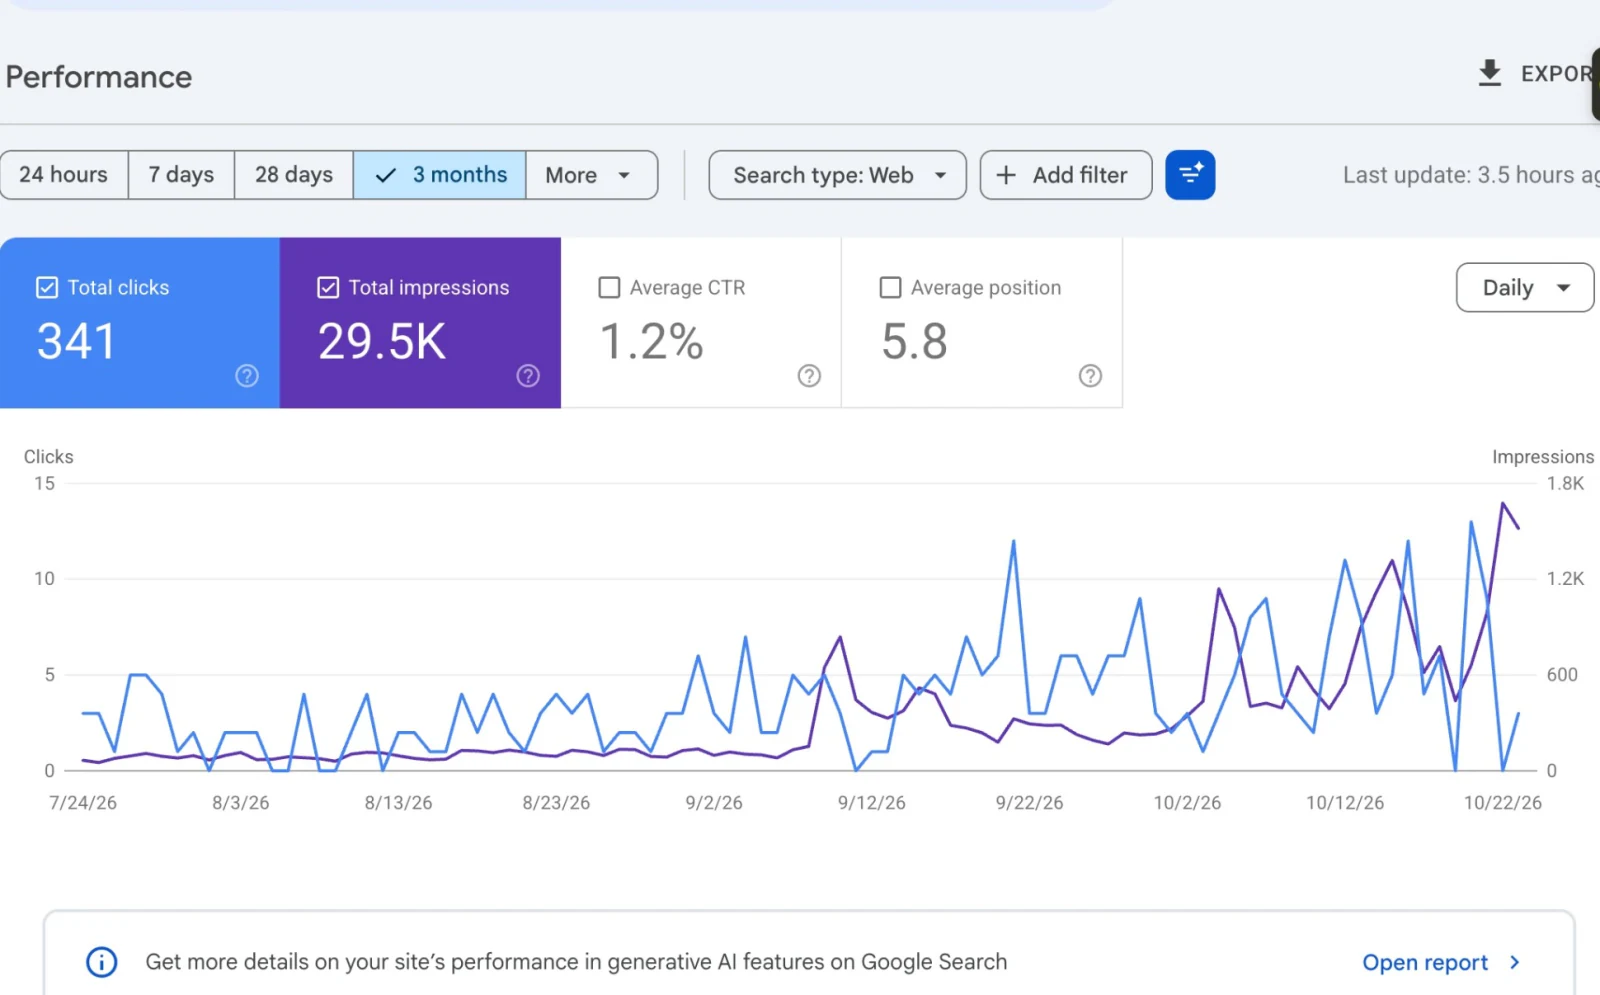
Google Search Console, pktransporters.com, 24 July to 22 October 2026: 341 clicks, 29.5K impressions, 1.2% CTR, average position 5.8. On-page SEO and content only; no link building.
- Naffees & Sons (nfsons.com), a construction company in Karachi: 782 clicks, 35,000 impressions, 2.2% CTR, average position 5.7. Daily impressions climbed from around 100 at the start of the window to more than 700 by late October, and daily clicks from a handful to the high teens and twenties.
- PK Transporters (pktransporters.com), a container haulage company in Karachi: 341 clicks, 29,500 impressions, 1.2% CTR, average position 5.8. Daily impressions rose from well under 200 to about 1,600 by late October. Search Console's page indexing report shows 38 pages indexed and 0 not indexed, up from about 12 indexed pages in early August.
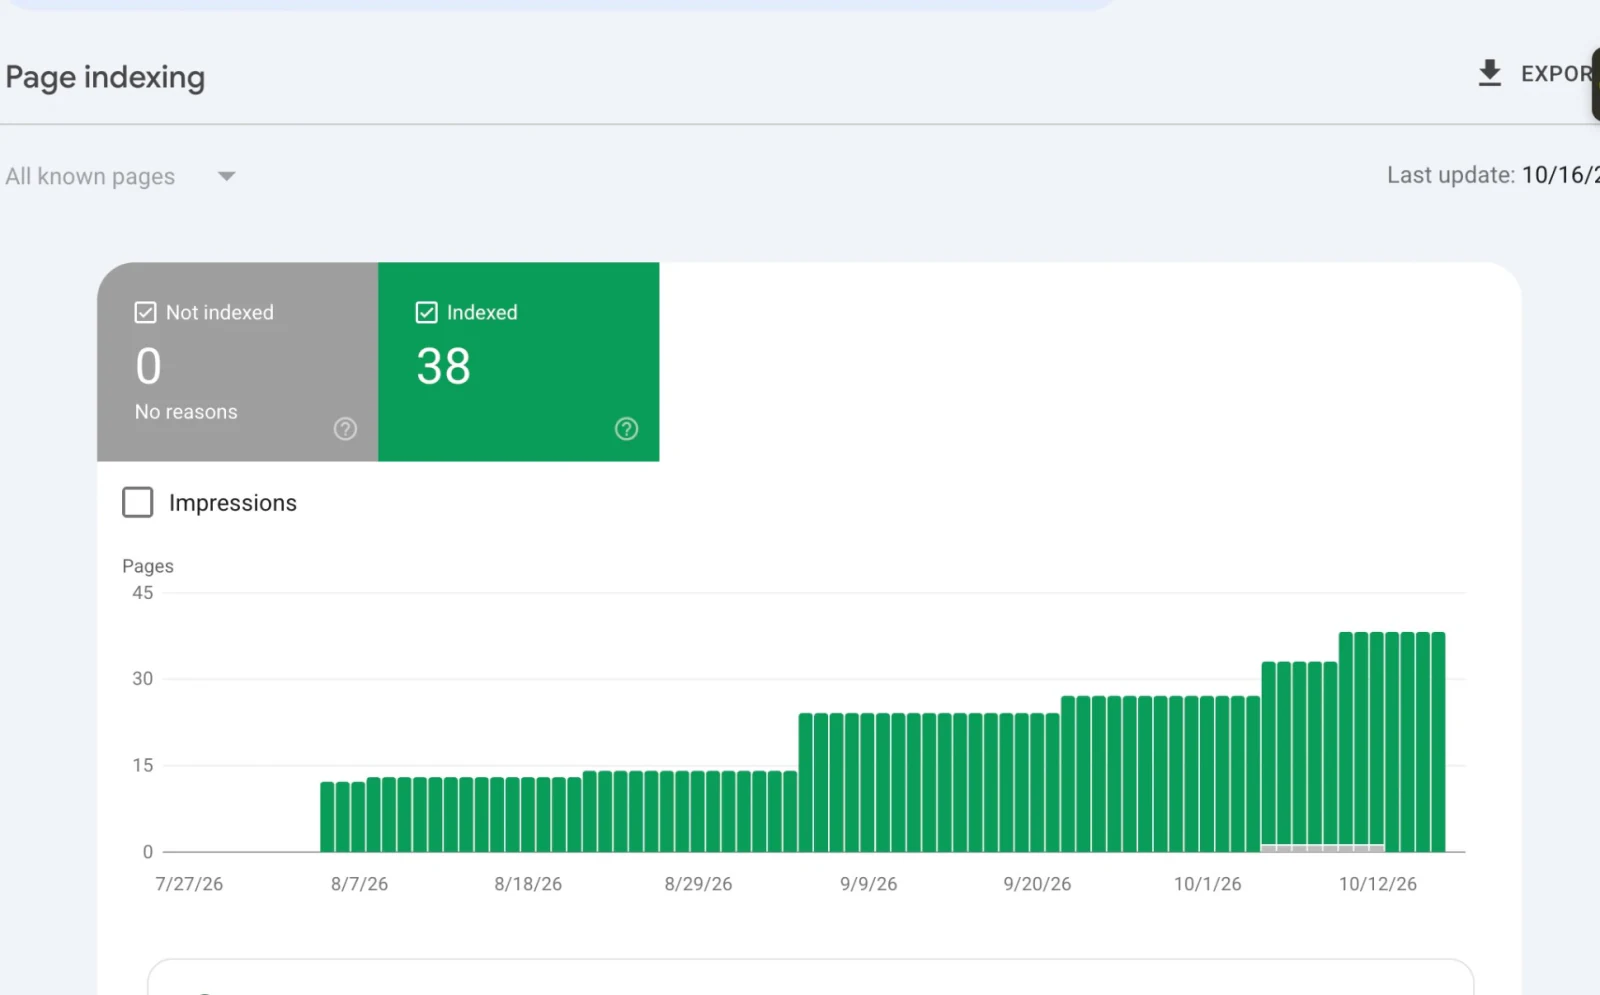
Google Search Console Page indexing, pktransporters.com, updated 16 October 2026: 38 pages indexed, 0 not indexed.
An average position under 6 across every query, without a single built link, is what happens when the site structure matches how buyers search. For Naffees & Sons that meant pages by plot size and by neighbourhood; for PK Transporters, a page for each service in each city. The full stories are in the Naffees & Sons and PK Transporters case studies.
Authority From Zero: The Hungry Pelican (2025)
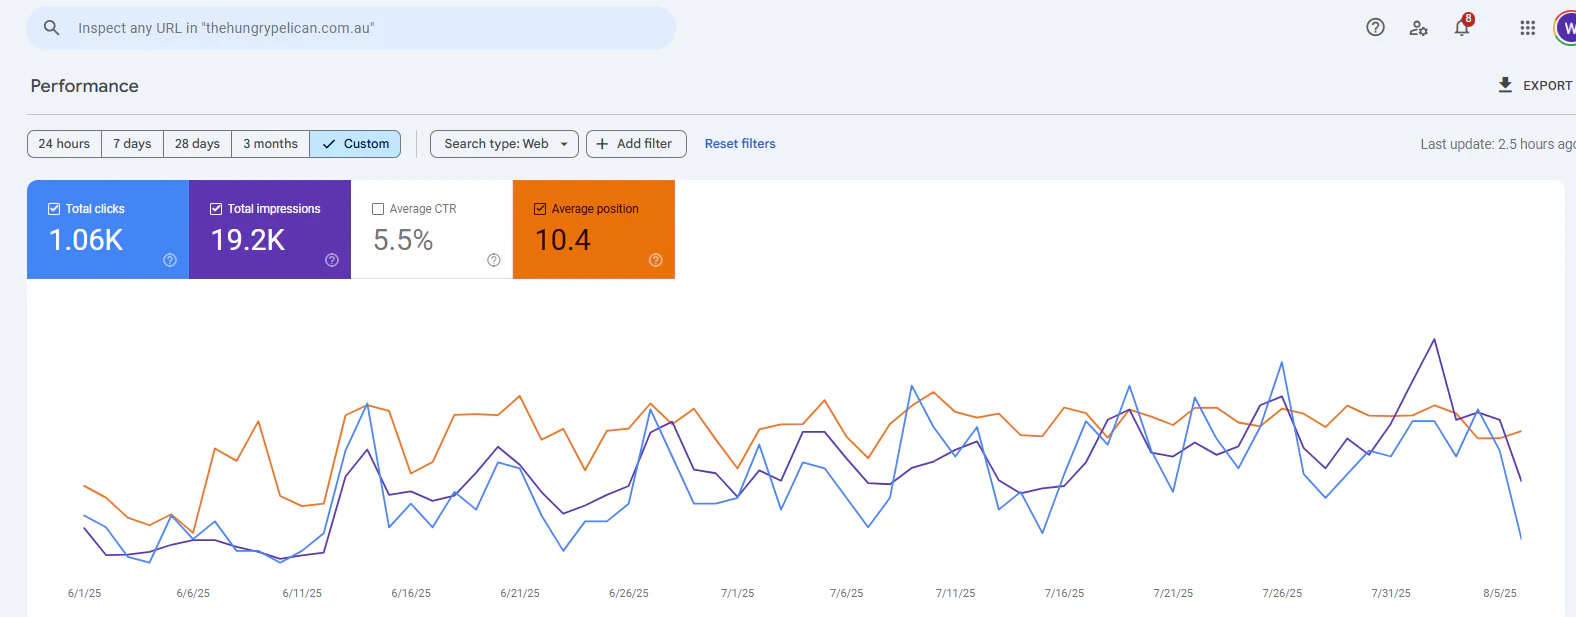
Google Search Console, thehungrypelican.com.au, 1 June to 5 August 2025: 1.06K clicks, 19.2K impressions, 5.5% CTR, average position 10.4.
The opposite shape to the two Karachi sites: a five-page cafe website with no authority. Here the work was on-page plus local link building, 17 backlinks from 12 referring domains. Semrush showed keywords going from 10 to 95 between 23 May and 6 August 2025. Full story: The Hungry Pelican case study.
Technical Fixes at Scale: DSL Warehouse (2023)
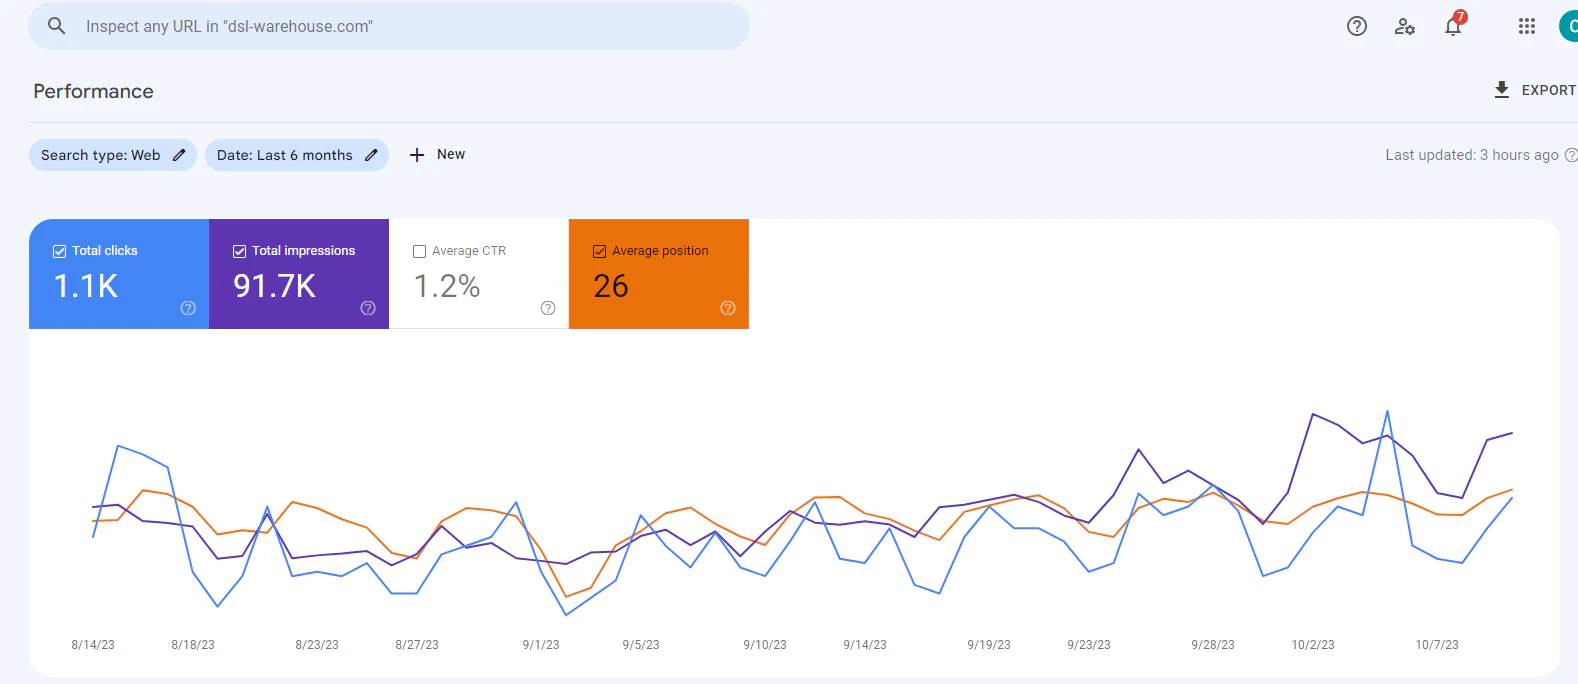
Google Search Console, dsl-warehouse.com. The report is set to the last 6 months but data starts in mid-August 2023: 1.1K clicks, 91.7K impressions, 1.2% CTR, average position 26.
An online store with thousands of product URLs, where we audited and fixed redirects, internal links and content across more than 100 pages. Data starts in mid-August, so this is about eight weeks: the highest impression count in this set, from the shortest 2023 window. Full story: DSL Warehouse case study.
Steady Ongoing SEO: Forest Hills Lab and First Source (2023)
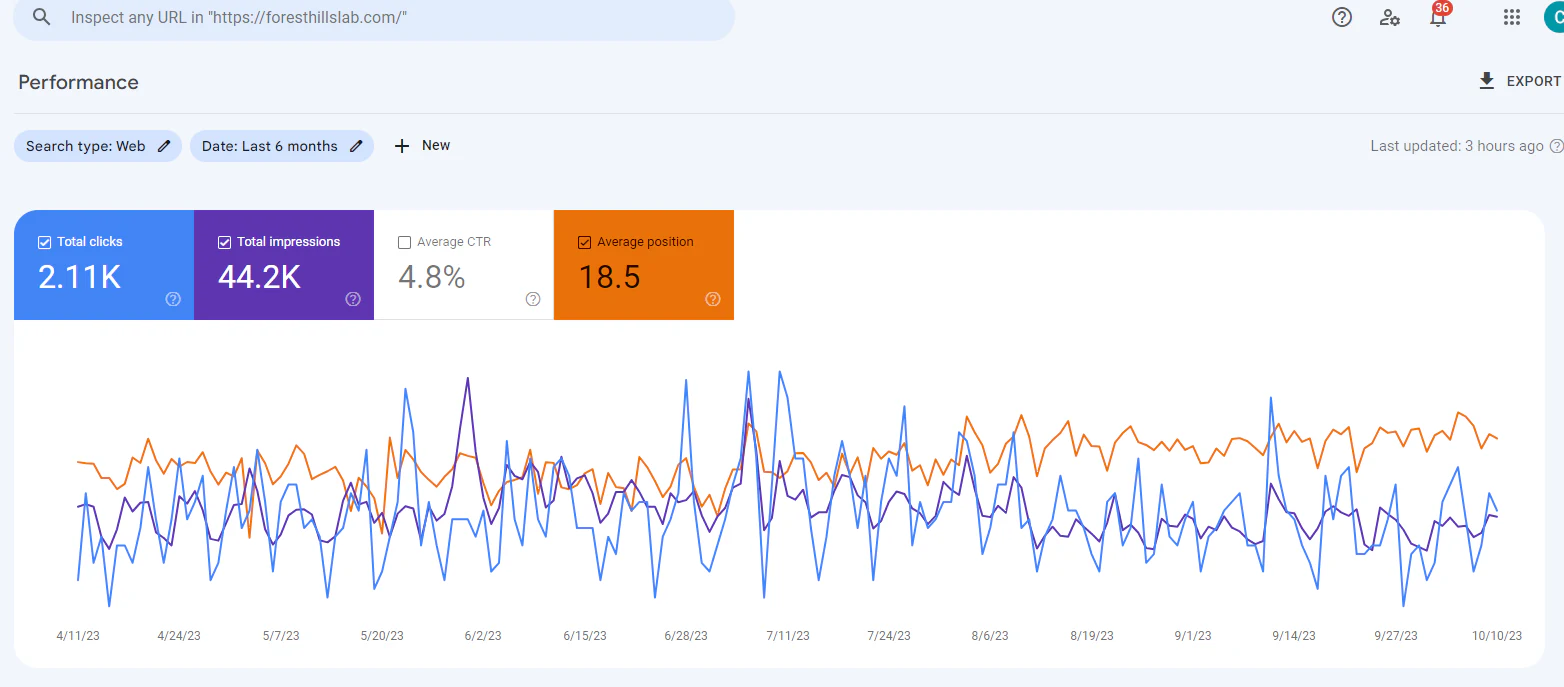
Google Search Console, foresthillslab.com, April to October 2023: 2.11K clicks, 44.2K impressions, 4.8% CTR, average position 18.5.
Forest Hills Lab is a Hong Kong life sciences company with a biopharmaceutical division and an aesthetics division. Its six-month window has the most clicks in this set, 2,110, and a 4.8% click-through rate, the highest of the non-restaurant sites. The orange average-position line drifts upward through the period, which in Search Console means rankings were improving (the position axis is inverted).
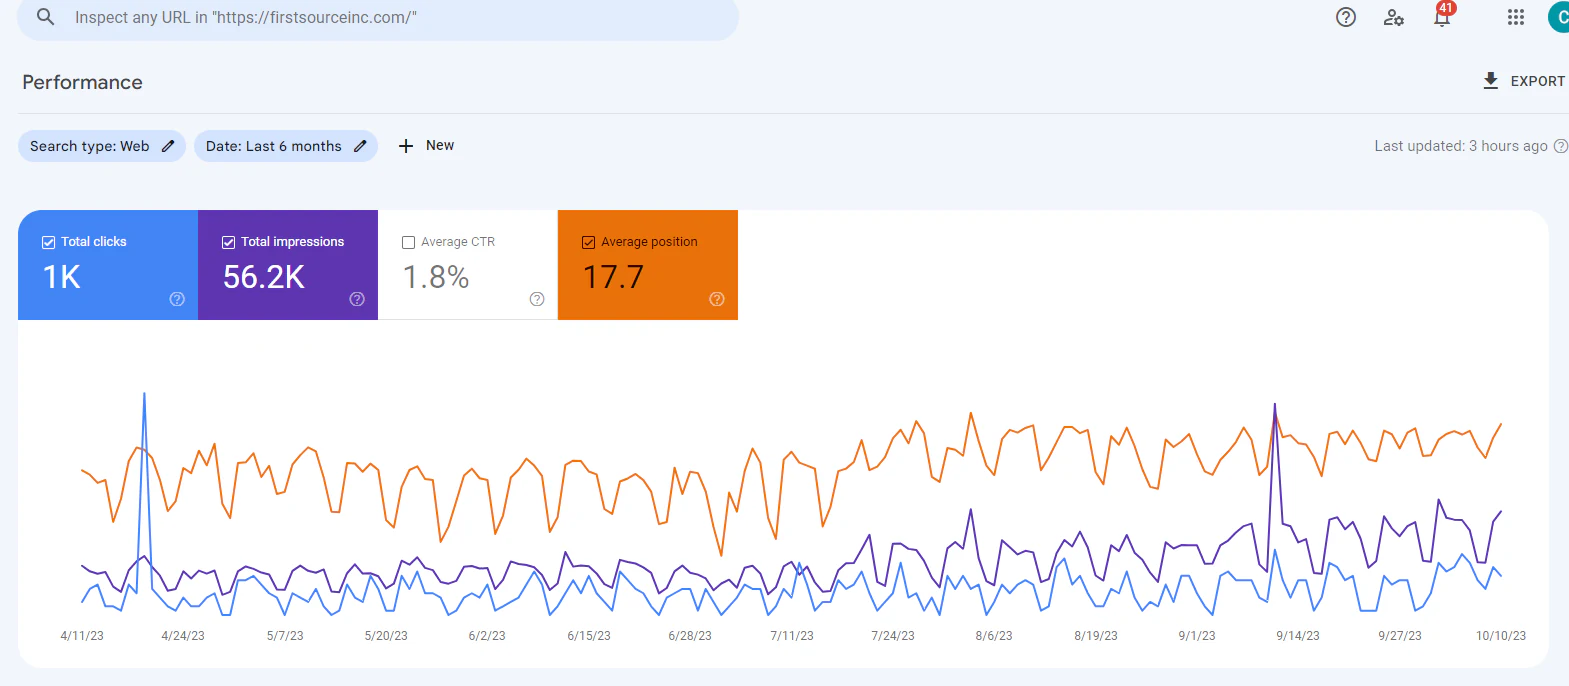
Google Search Console, firstsourceinc.com, April to October 2023: 1K clicks, 56.2K impressions, 1.8% CTR, average position 17.7.
First Source Inc represents manufacturers and stocks specialty RF, microwave, lightwave and millimetre-wave components, and has traded since 1985. Its chart has the clearest mid-period lift in the 2023 set: from July, impressions and average position both step up and hold. For a niche B2B supplier, 56,200 impressions from engineers searching for specific components is a meaningful audience. Full stories: Forest Hills Lab and First Source Inc.
The Flat Ones: Serenity at Heart and iPeepbxs (2023)
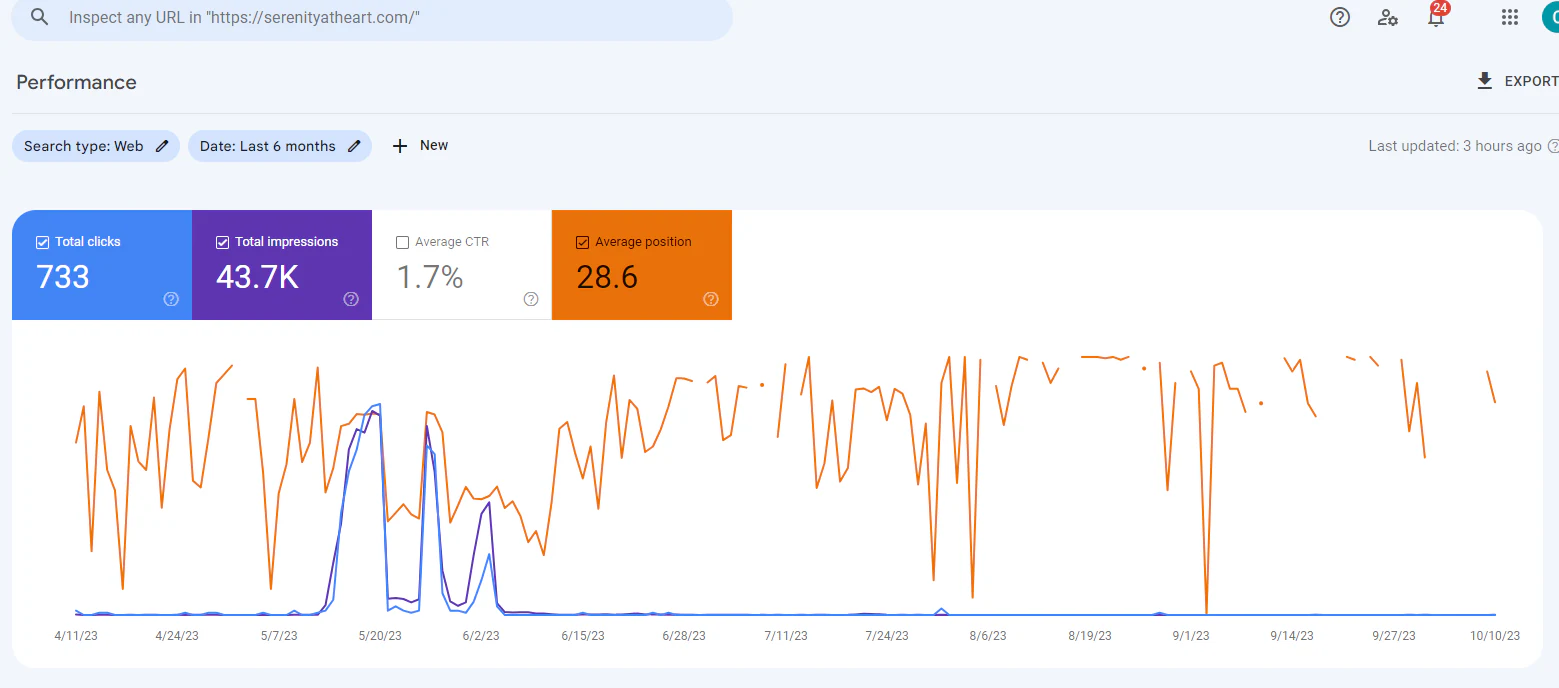
Google Search Console, serenityatheart.com, April to October 2023: 733 clicks, 43.7K impressions, 1.7% CTR, average position 28.6. Most clicks came in one burst in May and early June.
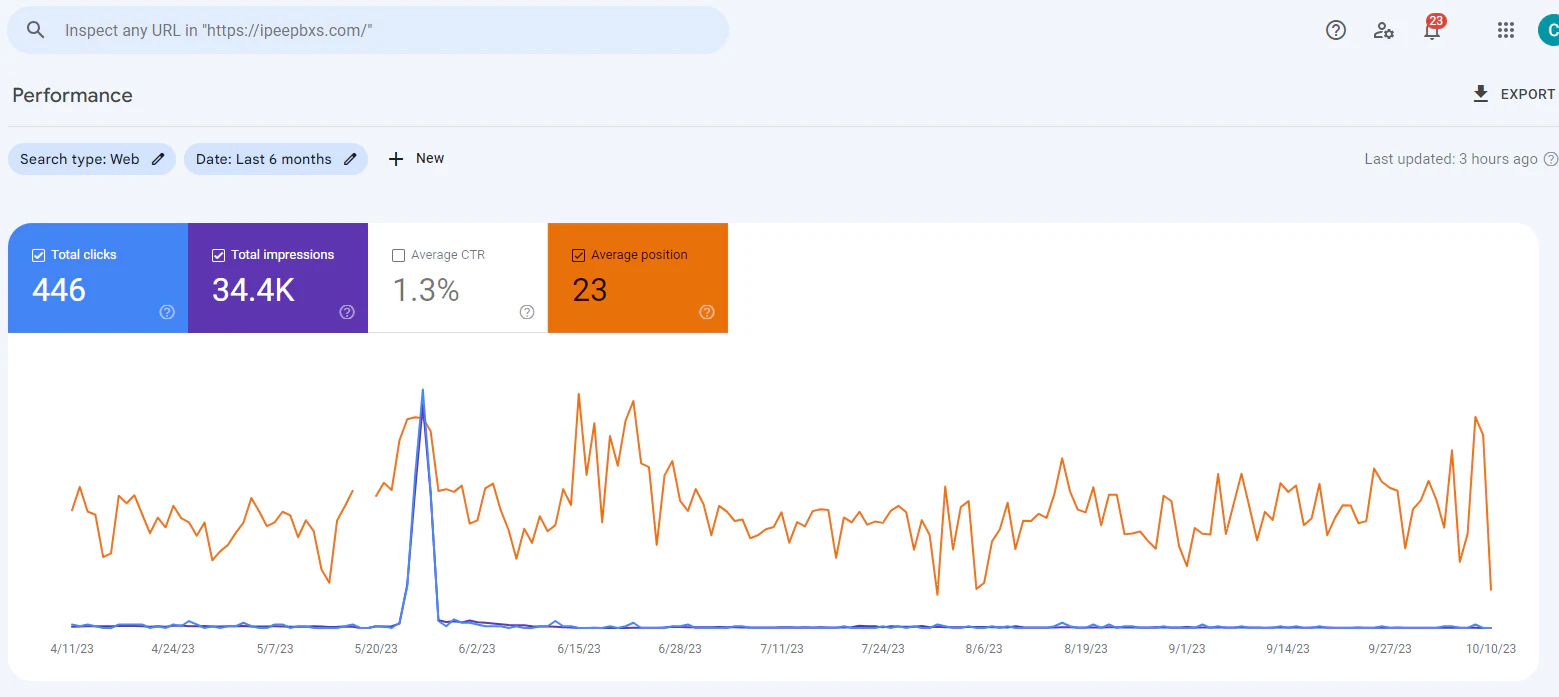
Google Search Console, ipeepbxs.com, April to October 2023: 446 clicks, 34.4K impressions, 1.3% CTR, average position 23. One spike in late May; flat otherwise.
Look at these two charts honestly and the story is not growth. Serenity at Heart, a faith-based nonprofit in Phoenix, had most of its 733 clicks in a burst between mid-May and early June, and very little either side. iPeepbxs, a business phone systems site, had one spike in late May and a flat line otherwise. Their totals look respectable in a table. Their charts show that one short window did most of the work.
We include them because this is the most common way SEO results get misrepresented. A six-month total can hide the fact that nearly all of it happened in one week. A spike is not a trend. When anyone shows you SEO results, ask for the chart, not the total. Both are written up in full: Serenity at Heart and iPeepbxs.
The Restaurant: Souvlaki Place (2023)
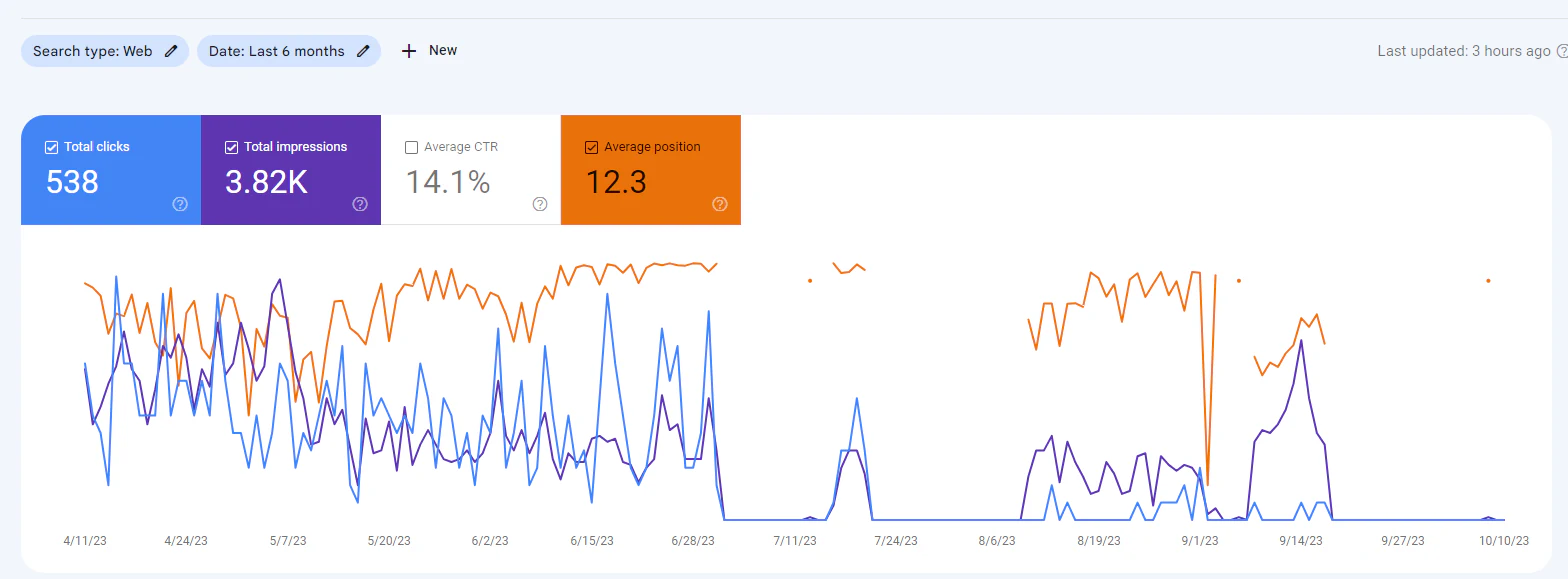
Google Search Console, souvlakiplace.ca, April to October 2023: 538 clicks, 3.82K impressions, 14.1% CTR, average position 12.3. Most of the activity falls between April and late June 2023.
A Greek restaurant on The Queensway in Etobicoke. The rankings were the result here: position 1 for "greek food near me", "greek near me" and "food near me", and a 14.1% click-through rate across 250 queries. The chart also shows that clicks were concentrated between April and late June 2023, with little recorded after that in this capture, and we show it as it is. The query-level story is in the Souvlaki Place case study.
What Nine Sites Teach
The best average positions came from building the site right, not from links. Naffees & Sons and PK Transporters, the two sites we built from scratch with content matched to how buyers search, have the best average positions in the set, under 6, with no link building at all. Structure and content come first.
New domains need authority. The Hungry Pelican had the opposite problem: a small site with no links. There, a modest amount of local link building moved it from unrated to an Authority Score of 16 in eleven weeks.
Large catalogues need technical work before content. DSL Warehouse produced the most impressions in the shortest window once redirects, internal links and content were fixed.
Click-through rate depends on intent. The restaurant converted 14.1% of impressions into clicks, because most of its searches were people looking for it by name or for food nearby. The catalogue store converted 1.2%, because it appears for thousands of part-number searches on page two. Neither number is good or bad on its own.
Ask for the chart. Two of the nine sites look fine in a table and flat on a chart.
A site with no structure for how buyers search needs a build with content matched to those searches, as with Naffees and Sons and PK Transporters. A small site with no authority needs local link building, as with The Hungry Pelican. A large catalogue with broken redirects and links needs a technical audit first, as with DSL Warehouse.
Organic Clicks vs Paid Clicks: Pricing the Portfolio
If all 8,110 clicks had been bought on Google Ads at LocaliQ's 2026 all-industry average of $5.42 a click (US data, updated 1 June 2026), they would have cost about $44,000. That figure is an illustration, not a saving: several of these businesses are outside the US, where clicks are usually cheaper; the restaurant and cafe would rarely pay for their name searches; and the windows span four years. The point it makes is the structural one. Paid clicks stop when the budget stops. Every one of these sites kept the pages and rankings that produced its clicks.
| Volume | Organic clicks | At $5.42 a click (all-industry average) | At $2.05 a click (restaurant average) |
|---|---|---|---|
| All nine windows | 8,110 | about $44,000 | about $16,600 |
| The two 2026 builds, three months | 1,123 | about $6,090 | about $2,300 |
The Competitor Pulse Check
| Factor | ValueStreamAI approach | Typical agency results page |
|---|---|---|
| Which results are shown | Every client site we have data for, flat ones included | The best chart, cropped |
| Source | Unedited Google Search Console screenshots | Rank-tracker graphs for chosen keywords |
| Date ranges | Stated on every image | Often missing |
| Client names | Named, with links | "A leading brand" |
| Build and marketing | The same team does both | Marketing only; the site is someone else's problem |
Frequently Asked Questions
Are these SEO results real?
Yes. Every image is an unedited Google Search Console or Semrush screenshot from a client property, captioned with the site, the tool and the date range. The same details are embedded in each image file's metadata. Where a chart is flat or shows a single spike, we say so.
What results can I expect from SEO?
It depends on the problem your site has. In this set, sites we built with content matched to buyer searches reached an average position under 6 in three months without link building, a new cafe domain went from 10 to 95 keywords in eleven weeks with local link building, and an online store produced 91,700 impressions in about eight weeks after a technical audit. Google's own guidance is that SEO usually takes four months to a year.
Is link building necessary for SEO?
Not always. Naffees & Sons and PK Transporters reached average positions of 5.7 and 5.8 with no link building. A new domain with few pages, like The Hungry Pelican, usually needs some, because Google has no other reason to trust it.
Why do some sites have a much higher click-through rate?
Because their searches are different. A restaurant searched by name and for food nearby converted 14.1% of impressions into clicks. A large store appearing for thousands of part numbers on page two converted 1.2%. Compare click-through rates within a type of business, not across them.
Why show results that are not good?
Because a results page that shows only the best chart proves nothing. Two of these sites had one spike and a flat line, and that pattern is exactly what a six-month total can hide. Showing it is how you can trust the rest.
Can you build my site and market it?
Yes. That is what we did for Naffees & Sons and PK Transporters, and it produced the best positions in this set. We build websites, web apps and AI platforms, then run the SEO and content, and connect the enquiries to automated follow-up.
What's Next
If you want results you can check in your own Search Console, start with a free call. We will look at your site, tell you which of the problems above you have, and what fixing it would take.
→ See our SEO and digital marketing services
→ How long does SEO take? What these nine sites show
→ See what building and marketing costs, or talk to us about your site